Reports & exports gives you the rows behind your numbers: every sale, new contact, enrollment, form entry and page view for the dates you choose. Preview a report on screen, then download it as a CSV file for a spreadsheet, your bookkeeping or another tool.
Who can do this
- Every team member can run and download reports: owners, admins, staff and viewers. Any plan, including the free trial.
- The Transactions, Contacts, Enrollments, Opt-ins and Memberships reports contain customer email addresses, and Partner payouts contains your partners' emails. Viewers can download them too, so give team access only to people you trust with that.
Run a report
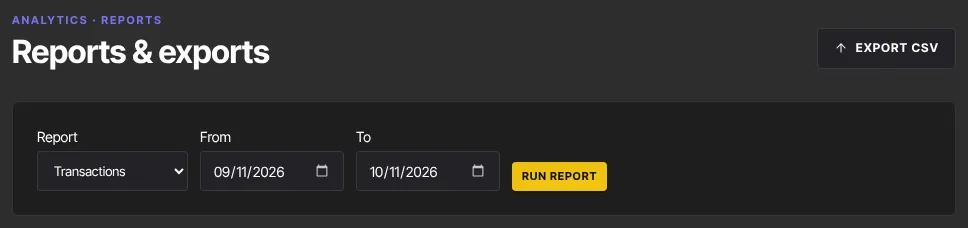
- Open Analytics and click Reports (
/analytics/reports). The page is titled Reports & exports. - Pick a Report.
- Pick a Period: Today, Yesterday, Last 7 days, Last 30 days, Last 90 days, This month, Last month, This quarter, Last quarter, Year to date or Last year. From and To fill in with its days. For any other range, choose Custom dates, or just change From or To and the period switches to Custom dates by itself. Both days are included. The page opens on Last 30 days.
- Click Run report.
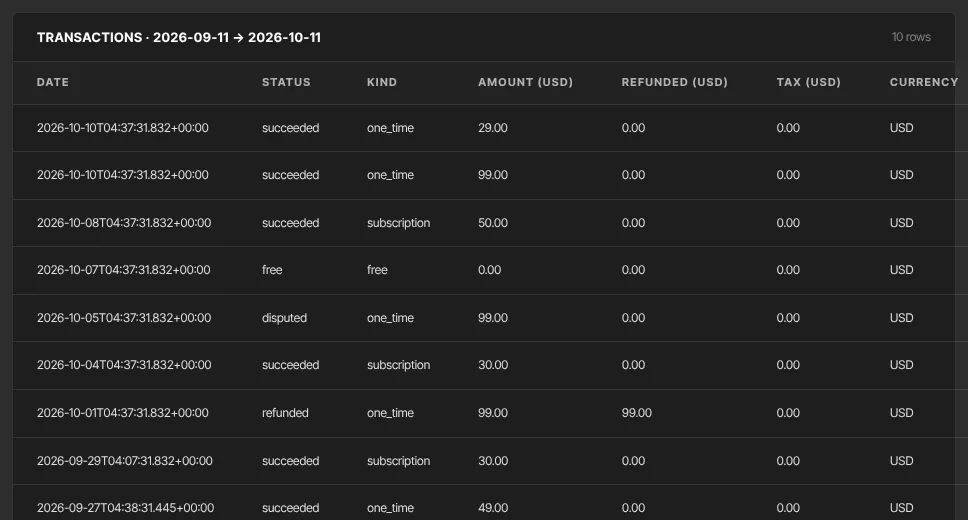
- The panel below shows the report's name, period and dates, how many rows it found, and the first 50. "previewing first 50" means the download holds more. A wide report scrolls sideways, long text such as a product name wraps onto a second line, and times show as date and time in UTC (hover for the full value).
A longer range than a year is cut to start 366 days before To, and if From is after To the two are swapped. Days are in UTC, and quarters are calendar quarters (January to March, and so on).
Save your own reports, and share them with your team
Keep the reports you run often one click away.
- Set the Report and Period (or Custom dates) you want.
- Click Save report and type a name such as "Monthly sales".
- To let everyone on your team use it, tick Share with my team.
- Click Save.
Your reports appear under Your saved reports at the top of the page, and reports teammates shared appear under Shared by your team, with the name of the person who shared each one. Click a name to run it. A report saved with a period, such as Last month, is worked out fresh each time it's opened, so it always shows the most recent month. One saved with Custom dates always shows those dates.
- Click the star to make a report one of your favorites. Favorites sit at the front of each list. Stars are yours alone: starring a teammate's shared report doesn't change it for anyone else.
- Click the people button on one of your own reports to share it with your team, or click it again to stop sharing. Only the person who saved a report can share it or stop sharing it.
- Click the × beside a report and confirm to delete it. You can delete your own reports. Owners and admins can also delete a report a teammate shared, for example after that person leaves. Deleting a saved report doesn't touch any data.
- Every team member, viewers included, can save up to 50 reports, each with a different name, and share any of them.
Download the CSV
- Run the report you want.
- Click Export CSV at the top right. The file is named after the report and its dates, such as
transactions-2026-09-01_to_2026-09-30.csv.
Export CSV downloads the report you last ran: change the report or dates without clicking Run report and the file holds the previous one. Money is written in dollars with two decimals, such as 49.00.
Which report answers which question
- Transactions: what did I earn, and from what? Every transaction created in the range, whatever its status: Date, Status, Kind, Amount (USD), Refunded (USD), Tax (USD), Currency, Product, Offer, Contact email and Payment intent. Status uses the system words: succeeded (paid), free, refunded, disputed or failed. Refunded (USD) is what went back to the buyer: the whole amount on a refunded line, or the part refunded on a line that stays succeeded, such as a partial refund issued from your Stripe dashboard.
- Contacts: how fast is my list growing? Everyone who joined your contact list in the range: Created, Email, First name, Last name, Marketing status, Lifetime value (USD) and Source.
- Enrollments: who got access to what, and how far each student got through a course? Access granted in the range: Enrolled, Status, Progress %, Product and Contact email.
- Offers sold: which offer carries the business? Paid sales in the range, one row per offer and product, biggest first: Offer, Product, Units sold and Revenue (USD). Every successful payment is a unit, so membership renewals count too. A partial refund comes off the revenue; a sale refunded in full isn't in the report.
- Opt-ins: are my forms working? Every form submission in the range: Date, Form, Contact email and Submitted data (the answers as sent, in a code-style format).
- Memberships: is recurring revenue healthy? Subscriptions started in the range: Created, Status, Offer, Product, Contact email, Amount (USD), Currency, Cancel at period end and Current period end. Its file is named
subscriptions-…csv. - Email performance: did that campaign land? One row per broadcast sent in the range, plus one per sequence email: Type, Name, Subject, Sent, Opens, Open %, Clicks, Click %, Unsubscribes and Sent at. Sequence emails always show all-time totals whatever dates you pick, with no Sent at. Unsubscribes are filled in for sequence emails only.
- Partner payouts: where do my affiliate payouts stand? Payout batches created in the range: Created, Partner, Partner email, Method, Status, Amount (USD), Period start, Period end, Paid at and Reference.
- Page views: is anyone finding my site? One row per page per day: Day, Path and Views, newest day first and busiest page first within a day.
How page views are counted
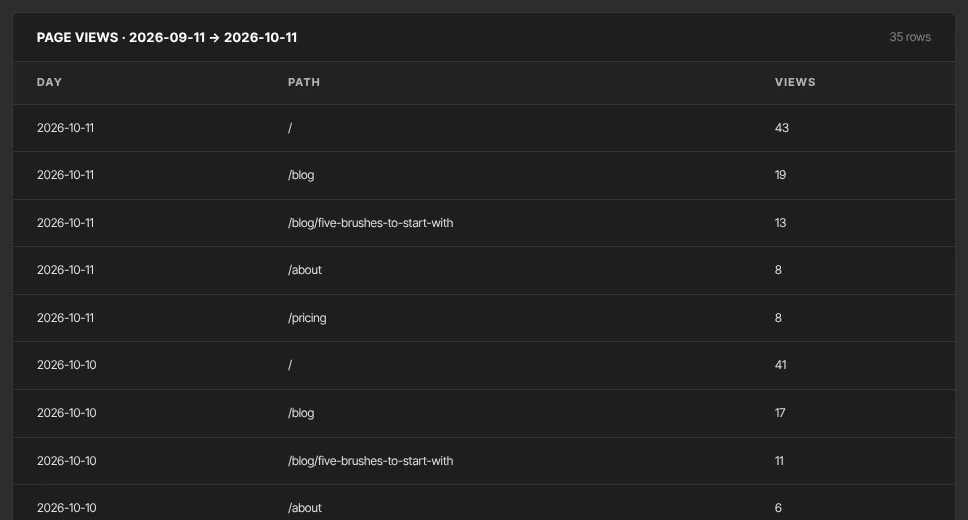
- A view is counted each time someone opens a published page of your site, your blog's main page or a blog post, your own visits to the live site included. Opening a page again counts again: these are views, not unique visitors.
- Paths leave out your web address and anything after a question mark, so
/pricing?ref=adcounts as/pricing. Your home page is/. - Not counted: editor previews, known search-engine crawlers and link-preview bots, checkout pages, hosted form and quiz pages, and pages inside the member library and courses.
- A members-only page counts even when the visitor is sent to sign in instead.
- We count views ourselves, with no cookie and no tracking script, and keep only the page, the day and the total. Counting carries on whatever you choose in Control analytics tracking on your site.
Limits to know about
- Each run reads up to 50,000 rows. If the count shows exactly 50,000 rows, some were left out: run shorter ranges and combine the files. Offers sold adds up every sale in the range, up to that same limit.
- Email performance counts opens and clicks for the broadcasts sent in the range, and lifetime figures for each sequence email (up to 50,000 engagement records each). For one broadcast in depth, see Broadcast results, limits and re-sending.
- Amounts are labelled USD, as the note under the table says. If you sell in another currency, the amount is in that currency: check the Currency column.
What happens next
Running or exporting a report changes nothing. New sales, contacts and page views appear the next time you run it, and today's views count as they happen.
Common errors
- "Nothing in this range. Adjust the dates or report type.": no rows for those dates. Widen the range or pick another report. A CSV of it holds only the column names.
- "Authentication required" when you click Export CSV: your session ended. Sign in again.
- "Something went wrong": the report couldn't be built. Try again, or try a shorter range.
- The file covers different dates from the screen: you changed the dates without clicking Run report. Run it, then export.
- A cell starts with an apostrophe ('): text beginning with =, +, - or @ gets one so your spreadsheet shows it as text instead of running it as a formula.
- A report disagrees with the dashboard: the dashboard runs back from this moment, while a report covers whole days. Line up the dates first.