Analytics is your business at a glance: how much money you made, list growth, new students, lessons completed, recurring revenue and quiz results, over a time window you pick. Use it to see how a launch went, to check whether you sold more this month than last month, or to pull a one-page summary into a spreadsheet with Export CSV.
Who can do this
- Every team member can open Analytics and download its summary: owners, admins, staff and viewers.
- It works on any plan, including the free trial.
- Your students never see it.
Open Analytics and pick a window
- In the sidebar, click Analytics (
/analytics). The heading shows your workspace name and "last 30 days". - Use the buttons at the top right to change the window: 7d, 30d, 90d or 1y. The heading and every panel follow your choice.
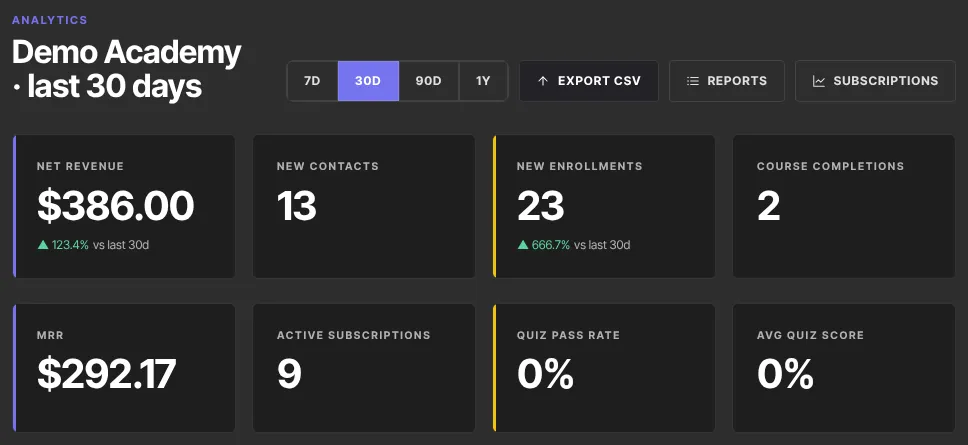
- A window always ends right now and runs back that many days, so 30d is the last 30 days, not this calendar month.
The headline tiles
- Net revenue: what your paid sales brought in during the window. A sale that was later refunded counts as nothing, a partly refunded sale counts only the part you kept, and a sale under an open dispute isn't counted.
- New contacts: people added to your contacts in the window.
- New enrollments: each time someone got access to a product in the window, whether they bought it, claimed it free or you granted it.
- Course completions: lessons your students marked complete in the window, one for each student and lesson. It counts lessons, not whole courses.
These four tiles show ▲ or ▼ with a percentage: the change against the period of the same length just before. The small label always reads "vs last 30d", even on the 7d, 90d or 1y view, but the comparison uses the matching earlier period. No percentage appears when that earlier period had nothing to compare with.
- MRR: monthly recurring revenue from paying memberships right now, worked out exactly as on Membership metrics: every price turned into a monthly figure after discounts, free trials and payment plans left out, and a membership with a payment being retried still counted. This tile ignores the window.
- Active subscriptions: memberships that are active or in a free trial right now.
- Quiz pass rate and Avg quiz score: worked out from each student's latest attempt at each quiz, across all time.
The panels
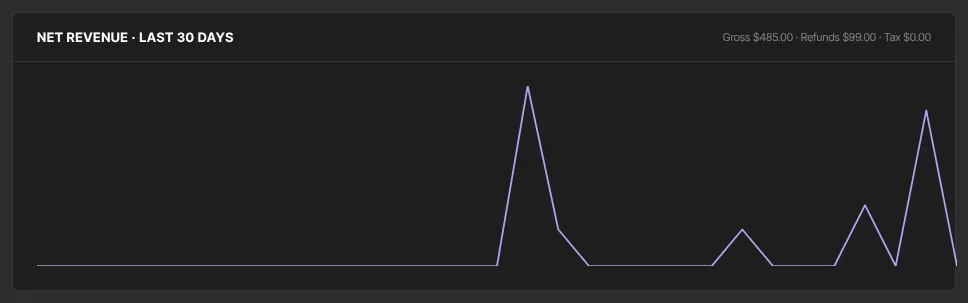
- Net revenue · last 30 days: a chart of paid sales per day, less any partial refunds. Beside the title, Gross is everything charged in the window (refunded sales included), Refunds is the part of those sales that went back to buyers, partial refunds included, and Tax is the tax collected on paid sales.
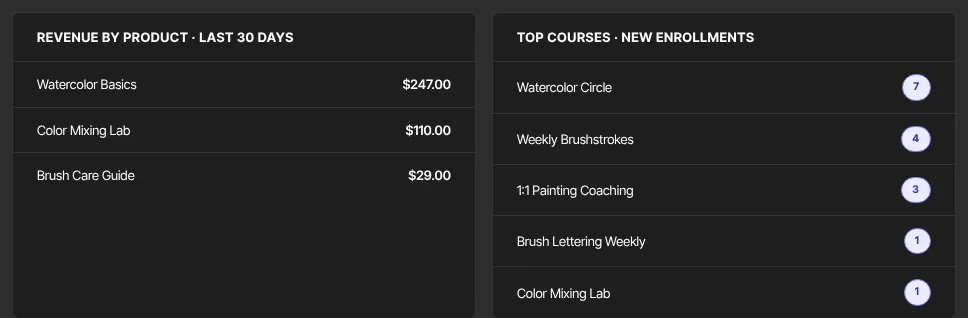
- Revenue by product and Revenue by offer: your five biggest earners in the window, after any partial refunds. A sale whose product or offer has since been deleted isn't listed here, but still counts in Net revenue.
- Top courses · new enrollments: the five products that gained the most students in the window.
- Recent transactions: your ten latest transactions, whatever the window, with their status ("succeeded" means paid).
- Form submissions: your five busiest forms in the window.
- Quiz performance: attempts and pass rate overall, and the pass rate of your five most-taken quizzes.
- New contacts: a chart of new contacts per day.
For memberships in more depth (churn, lifetime value, retention), click Subscriptions at the top right. See Membership metrics.
Download the summary as a CSV
- Pick the window you want.
- Click Export CSV. Your browser saves a file named like
analytics-30d.csv.
The file has three columns, Section, Metric and Value. It lists the window's start and end, the headline numbers, then revenue by product, top courses, revenue per day, revenue by offer and the pass rate of each quiz. Money is in cents, so 4900 means 49.00. It holds totals and product names only, no customer details. Avg quiz score, Recent transactions and Form submissions aren't in it.
For every sale or contact row by row, use Reports and CSV exports.
Ask the AI Advisor what the numbers mean
Click AI Advisor at the top right (/analytics/advisor) for a written read of these numbers: what's working, what isn't, and the next thing to do, each with the figures behind it and a link to the screen where you'd act. See The AI Advisor.
Things to know about the numbers
- Amounts are shown in US dollars whatever currency you sell in, and sales in different currencies are simply added together.
- Days are counted in UTC.
- A partial refund, such as $10 back on a $100 sale made by Zinstruct support, takes $10 off Net revenue, the daily chart and the revenue panels, and adds $10 to Refunds. Like a full refund, it counts on the day of the sale, not the day of the refund. The sale itself stays paid, so Recent transactions still lists it at $100 as "succeeded".
- The dashboard adds up to 50,000 sales, new contacts, enrollments and lesson completions each across the window and the period before it. A school past that on the 1y view should use a shorter window, or check the all-time Net figure at the top of Revenue → Transactions, which isn't limited this way.
What happens next
Opening Analytics or exporting changes nothing: these are read-only views. New sales, contacts and completions show up the next time you load the page.
Common errors
- "No revenue in this window yet. Sales recorded through checkout will chart here.": there were no paid sales in the window. Try 90d or 1y.
- "Authentication required" after clicking Export CSV: your session ended. Sign in again, then click Export CSV again.
- "Something went wrong": the summary couldn't be built. Reload the page and try again.
- A tile disagrees with a report: check both cover the same dates. The dashboard runs back from this moment; a report covers whole days from From to To.